Business Review
Trading performance.
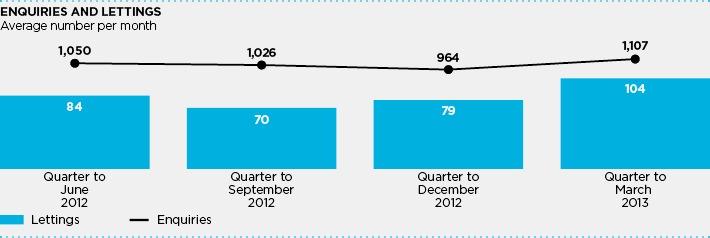
Our aim is to be the preferred choice for new and growing businesses looking for space in London. We have continued to attract strong levels of demand with enquiry levels up 3% on the prior year to an average of 1,037 per month, and new lettings running at an average of 84 per month (2012: 82 per month). Good levels of enquiries and lettings have continued into the first quarter of the current financial year.
| Quarter Ended | ||||
| Average number per month |
March 2013 |
Dec 2012 |
Sept 2012 |
June 2012 |
| Enquiries | 1,107 | 964 | 1,026 | 1,050 |
| Lettings | 104 | 79 | 70 | 84 |
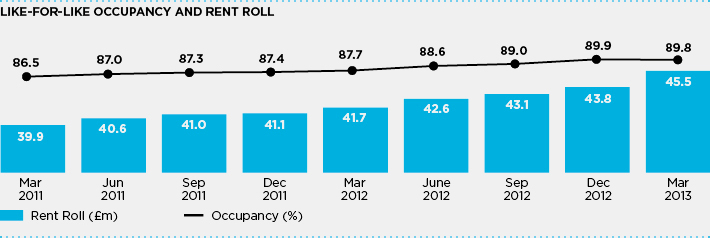
The like-for-like property portfolio, which excludes properties impacted by refurbishment or redevelopment, has seen both occupancy and rents improve strongly over the year reflecting the consistent high level of customer demand. Occupancy improved by 2.1% to 89.8% and rent per square foot is up by 6.6%. This has produced a strong growth in like-for-like rent roll of 9.1% (2012: 4.7%).
| Like-for-like properties |
31 March 2013 |
30 September 2012 |
31 March 2012 |
| Number | 68 | 68 | 68 |
| Occupancy | 89.8% | 89.0% | 87.7% |
| Rent roll | £45.5m | £43.1m | £41.7m |
| Rent per sq. ft. | £13.75 | £13.12 | £12.90 |
Overall occupancy is 87.0% at March 2013 (March 2012: 85.3%) and cash rent roll has increased to £52.7m (March 2012: £50.2m). The strong growth in like-for-like rent roll has been off-set by the net loss of income at properties where we are undertaking refurbishment and redevelopment activity and property disposals made during the year:
| £m | |
| Rent roll at 31 March 2012 | 50.2 |
| Like-for-like rent roll growth | 3.8 |
| Rent reduction on redevelopment and refurbishment underway | (0.9) |
| Increase in rent from newly refurbished space | 0.6 |
| Rent roll on property disposals | (1.0) |
| Rent roll at 31 March 2013 | 52.7 |
The contracted rent roll is £2.3m higher than the cash rent roll at £55.0m at March 2013. This relates primarily to stepped rent increases and rent free periods, with around 75% expected to convert to cash rent roll in the next year.
Driving enquiries and lettings
MARKETING
Cathie Sellars (centre), Head of Marketing discussing enquiries and deals with James Friedenthal, Managing Director Club Workspace and Kylie Ferns, Marketing Executive.
CUSTOMER UNDERSTANDING
We interact directly with our customers. We don't rely on agents. Over 90% of our lettings come from internally generated leads and managed transactions.
OVER 26,000 UNIQUE WEB VISITS PER MONTH TO WORKSPACE.CO.UK
26,000+

£m |
31 March 2013 |
31 March 2012 |
| Net rental income – underlying | 46.5 | 43.7 |
| Net rental income – disposals | 0.6 | 1.1 |
| Joint venture income | 1.1 | 0.5 |
| Administrative expenses | (11.0) | (10.2) |
| Net finance costs | (19.3) | (19.1) |
| Trading Profit after Interest | 17.9 | 16.0 |
| Change in fair value of investment properties | 59.0 | 35.6 |
| Other Items | (0.5) | (3.1) |
| Profit before tax | 76.4 | 48.5 |
| EPRA earnings per share | 12.2p | 11.9p |
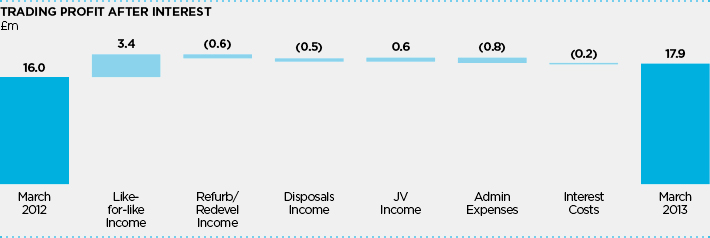
The improving levels of occupancy and pricing have translated into a good growth in income with underlying net rental income up 6% (£2.8m) in the year to £46.5m. The growth in net rental income at like-for-like properties of 9% (£3.4m) and new income from completed refurbishments of £0.3m is offset by income reduction of £0.9m at properties currently being refurbished and redeveloped.
Joint venture (JV) income represents our 20.1% share of net rental income from the properties in the BlackRock Workspace JV. Income has grown as properties have been acquired by the JV with the initial investment phase completed in October 2012. The portfolio comprised of 16 properties with a rent roll of £7.0m at March 2013.
Administrative expenses have increased by 8% (£0.8m) in the year. Long-term incentive plan costs have increased by £0.8m as a result of the improved share price performance alongside a £0.2m increase in salary and bonus costs offset by net savings of £0.2m in other cost categories.
Net finance costs increased by £0.2m with net debt increasing by £14m to £328m over the year as a result of increased capital expenditure but the weighted average interest cost fell by 0.1% to 5.0% (2012: 5.1%).
Trading profit after interest is up 12% in the year to £17.9m reflecting the strong growth in rental income.
Profit before tax is up 58% to £76.4m with the improved trading performance supplemented by an underlying increase of 8% (£59.0m) in the property valuation.
EPRA earnings per share has increased by 3% to 12.2p, lagging the growth in trading profit following the Rights Issue which was completed in July 2011.
DIVIDEND
The Board has proposed a final dividend of 6.45 pence per share, (2012: 5.86 pence) which will be paid on 2 August 2013 to shareholders on the register at 12 July 2013. This dividend will be paid as a normal dividend (non-PID). The total dividend for the year is 9.67 pence, a 10% increase on the prior year, which is covered 1.26 times by EPRA earnings per share.
PROPERTY VALUATION
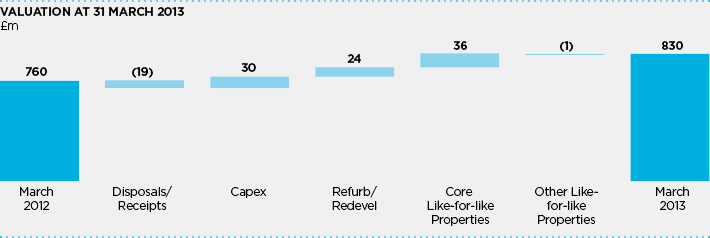
At 31 March 2013 the wholly owned portfolio was independently valued by CBRE at £830m, an underlying increase of 8% (£59m) in the year. The main elements of the increase in the valuation over the year are set out below:
| £m | |
| Valuation at 31 March 2012 | 760 |
| Property Disposals | (15) |
| Capital expenditure | 30 |
| Revaluation surpluses: | |
| 6 Months to September 2012 | 18 |
| 6 Months to March 2013 | 41 |
| Capital Receipts | (4) |
| Valuation at 31 March 2013 | 830 |
A more detailed analysis of our properties at 31 March 2013 is set out in Table 1.
Workspace delivered a total property return over the year of 13.8%, well ahead of the IPD Universe (Quarterly) at 3.2%. This strong performance came from:
- A £36m uplift in value at the core like-for-like properties from driving increases in occupancy and rent roll (which is up 10% in the year) with no benefit from movement in valuation yield, offset by a marginal fall of £1m in the value of other like-for-like properties; and
- A £24m uplift in value from our refurbishment and redevelopment activity, mainly in the second half of the year. There was a £6m increase at each of Grand Union Centre, W10 and Bow Enterprise Park, E3 following the signing of development agreements in October 2012. There was also an £8m increase at Tower Bridge Business Complex, SE16 ahead of achieving planning consent at this site (subsequently achieved in May 2013) with a further uplift in valuation expected in the current financial year.
The other property category represents generally good quality but small properties, primarily industrial estates, where the opportunity for Workspace to add premium operational or brand value is limited.
During the year we realised £13m from the disposal of six non core properties at a loss of £2m compared to book value at March 2012. A further three properties are currently under offer for £8m in line with their book values at March 2013.
The net initial and equivalent yields of our portfolio as reported by CBRE are set out below:
| Net initial yield | Equivalent yield | |||
| At 31 March | 2013 | 2012 | 2013 | 2012 |
| Like-for-like Properties | 7.3% | 7.2% | 8.1% | 8.3% |
| Refurbishment/Redevelopment | 5.3% | 6.6% | 8.1% | 8.9% |
| Total | 6.9% | 7.1% | 8.1% | 8.4% |
The total net initial yield is impacted by the declining yield at refurbishment and redevelopment properties where we are running down income. The like-for-like (investment) net initial yield has softened marginally to 7.3%.
Total Estimated Rental Value (ERV) of the overall portfolio at March 2013 is £67.4m (March 2012: £65.4m). The ERV of the like-for-like portfolio is £51.3m up 4.0% in the year (March 2012: £49.3m). Capital value per sq. ft. is £177 up from £152 at March 2012.
REFURBISHMENT ACTIVITY
During the year we completed four refurbishments:
- 49,000 sq. ft. refurbishment and two storey roof extension at Canalot Studios (cost: £5m)
- 7,000 sq. ft. side extension at Whitechapel (cost: £2m)
- 9,000 sq. ft. roof extension to Chester House at Kennington Park (cost: £2m)
- 27,000 sq. ft. of new industrial buildings at Leyton, E10 (cost: £3m)
We have seen good progress with the letting up of the space at these schemes at pricing levels ahead of our expectations when these projects were approved. The rent roll at these four properties at 31 March 2013 was £0.7m. We would expect to achieve an uplift in rent roll of £1.2m to £1.9m at current estimated rents once these schemes reach 90% occupancy.
Refurbishment is underway at a further four properties as shown in Table 2.
These properties were valued at £49m at March 2013 with rent roll of £1.9m. £11m of the total estimated capital expenditure of £30m has been incurred on these projects to date. We expect to achieve an uplift in rent roll of £3.3m to £5.2m, at current estimated rents, once these schemes are completed and have reached 90% occupancy.
TABLE 1:
PROPERTIES AT 31 MARCH 2013
| Core | Other | |||
| Like-for-like | Refurbishment | Redevelopment | Like-for-like | |
| No of properties | 47 | 8 | 10 | 21 |
| Valuation | £509m | £110m | £155m | £56m |
| Revaluation surplus | £36m | £4m | £20m | (£1m) |
| Rent roll yield | 7.8% | 4.4% | 2.5% | 7.6% |
TABLE 2:
REFURBISHMENT ACTIVITY
| Estimated Cost |
Expected Completion |
Upgraded Area (sq. ft.) |
New Area (sq. ft.) |
|
| Westminster (Phase I), SE11 | £2m | H1 2013 | 6,000 | 5,000 |
| Exmouth House, EC1 | £4m | H1 2013 | 52,000 | 5,000 |
| The Pill Box, E2 | £9m | H1 2014 | – | 42,000 |
| Metal Box Factory, SE1 | £15m | H2 2014 | 82,000 | 20,000 |
REDEVELOPMENT ACTIVITY
Many of our properties are in areas across London where there is strong demand for mixed use redevelopment. These schemes generally require demolition of an existing building to deliver new residential and commercial space. We obtain mixed use planning consent and then agree terms with a residential developer to undertake the construction at no cost to Workspace. We generally receive back new commercial space together with a combination of cash and overage in return for the sale of the residential component to the developer.
In October 2012 we announced that we had exchanged contracts for the redevelopment of Grand Union, W10 and the first phase of Bow Enterprise, E3:
- At Grand Union we will receive back on completion of the redevelopment a new 60,000 sq. ft. business centre together with £5.9m of cash that will be paid over the development period together with overage on the private residential component.
- At Bow Enterprise we received £11.5m of cash in April 2013 having achieved vacant possession of the site in six months, and on completion of the redevelopment we will receive 15,000 sq. ft. of new industrial space and overage on the private residential component.
We have now signed development agreements for four redevelopment schemes for a total of 693 residential units as detailed in Table 3.
On these four schemes Workspace will receive a total of 189,000 sq. ft. of new business space, cash of £22m and overage on the residential component of the schemes. These properties were valued at £73m at March 2013 with rent roll of £0.3m which will fall to zero during redevelopment. At current estimated rents and 90% occupancy we would expect the new business space to deliver £3.8m of rent roll.
In May 2013 we received planning consent for a further two mixed use redevelopments:
- At Tower Bridge Business Complex, SE16 we secured planning on the northern part of this large 12 acre site for 800 residential units and 60,000 sq. ft. of new business space.
- At Faircharm Estate, SE8 we secured planning for 148 residential units and 52,000 sq. ft. of new business space.
These two properties, together with Bow (Phase 2), E3 where we have already obtained planning consent for 290 residential units and 30,000 sq. ft. of business space were valued at £43m at 31 March 2013 with rent roll of £1.8m.
CASH FLOW AND FINANCING
Our customer payment profile and cash collection statistics are strong with bad debts in the year of £0.3m (2012: £0.4m). Net debt has increased by £14m to £328m over the year due to an acceleration in capital expenditure on refurbishment projects. A summary of the movements in cash flow is set out below:
| £m | |
| Net cash from operations | 22 |
| Dividends paid | (13) |
| Capital expenditure | (29) |
| Property disposals/capital receipts | 17 |
| Investment in joint ventures | (8) |
| Retail Bond issue | 58 |
| Net repayment of bank borrowings | (58) |
| Other | (3) |
| Net movement in year | (14) |
| Net debt at 31 March 2012 | (314) |
| Net debt at 31 March 2013 | (328) |
TABLE 3:
REDEVELOPMENT ACTIVITY
| Developer | Expected Completion |
Residential Units |
Commercial Area (sq. ft.) |
Cash | Other | |
| Wandsworth, SW18 | Mount Anvil | H2 2014 | 209 | 53,000 | – | Overage |
| ScreenWorks, N5 | Taylor Wimpey | H1 2014 | 72 | 61,000 | £5m | Overage |
| Grand Union, W10 | Taylor Wimpey | H1 2015 | 145 | 60,000 | £6m | Overage |
| Bow (Phase 1), E3 | Peabody | H2 2015 | 267 | 15,000 | £11m | Overage |
At 31 March 2013 the Group had £383m of committed facilities with an average period to maturity of 2.9 years and the earliest maturity in June 2015. Details are set out below:
| Committed Facilities |
Drawn Amount |
Maturity | |
| RBS/HSBC Club | £125m | £80m | Jun 2015 |
| Bayern Club | £200m | £200m | Jun 2015 |
| Retail Bond | £58m | £58m | Oct 2019 |
| Total | £383m | £338m |
At 31 March 2013 there were £45m of available facilities and £10m in cash deposits. Overall loan to value was 40% with good headroom on all of bank and bond covenants.
Our interest rate hedging is structured to maintain a stable interest rate over the medium term. At 31 March we had £210m of fixed rate hedges at 2.9% out to June 2015, alongside the fixed 6% Retail Bond out to October 2019. The weighted average interest rate on debt in the year was 5.0% (2012: 5.1%).
During the year we have focused on diversifying our funding, extending the maturity profile and moving progressively to an unsecured basis to provide operational flexibility.
In October 2012 we raised £57.5m from an unsecured Retail Bond issue with a 6.0% coupon and a maturity date of October 2019. The proceeds were used to repay secured bank borrowings.
On 10 June 2013 we agreed the refinancing of the Group's remaining bank facilities through a combination of:
- The issue of £157.5m of unsecured private placement notes, £148.5m with a 10 year maturity and £9m with a seven year maturity;
- Unsecured debt of £45m provided by a UK Fund with a 9/10 year maturity; and
- £150m of unsecured five year bank debt provided by our core relationship banks, comprising RBS, HSBC and Santander.
With effect from 1 July 2013 these new unsecured facilities will replace the existing secured bank facilities. Details on a pro forma basis of the Group's facilities from 1 July 2013 are set out below:
| Facility | Maturity | |
| Private Placement notes | £148.5m | June 2023 |
| UK Fund | £45m | June 2022/2023 |
| Private Placement notes | £9m | June 2020 |
| Retail Bond | £57.5m | October 2019 |
| Bank debt | £150m | June 2018 |
| Total | £410m |
The refinance extends the weighted average maturity of our debt at 31 March 2013 from 2.9 years to 7.8 years. Following the refinance we expect the weighted average interest rate on our debt (based on the drawn debt at 31 March 2013) to be around 5.4%. It will be necessary to amend/cancel existing interest rate hedges at an estimated cost of around £10m.
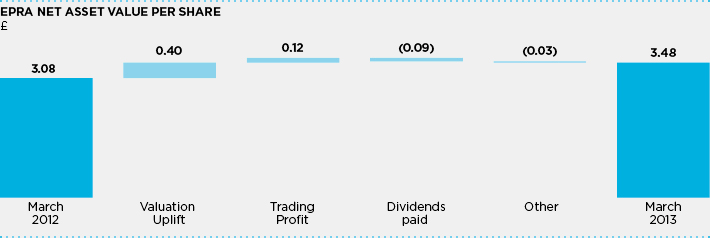
EPRA net asset value per share at 31 March 2013 was £3.48 (2012: £3.08), an increase of 13% in the year with the main movements in net asset value per share highlighted below:
| EPRA NAV per share | £ |
| At 31 March 2012 | 3.08 |
| Property valuation surplus | 0.40 |
| Trading profit after interest | 0.12 |
| Dividends paid in year | (0.09) |
| Other | (0.03) |
| At 31 March 2013 | 3.48 |
BLACKROCK WORKSPACE PROPERTY TRUST (BLACKROCK JV)
We have a 20.1% interest in BlackRock JV for which we also act as property manager receiving management and performance fees. It was initially seeded with eight properties sold by Workspace to the JV in February 2011 for £35m. The fund has acquired a further eight properties to complete the initial investment phase (allowing for the future capital expenditure). As at 31 March 2013 the valuation of these properties stood at £96m, with an underlying increase in the valuation of 5% (£3m) in the year.
Subsequent to the year end, Cam Road, Stratford was sold for £7.6m, a £0.6m surplus to its book value at March 2013. It is intended to reinvest the proceeds in further property acquisitions.
PRINCIPAL BUSINESS RISKS
Risk management is an integral part of our activities and day to day running of the business. Risks are assessed, discussed and taken into account when deciding upon future strategy, approving transactions and monitoring performance. The process of identifying risks, assessing their impact and monitoring their likelihood is considered at two levels:
- Strategic Risks:
These are identified, assessed and managed by the Main Board and Audit Committee. - Operational Risks:
These are identified, assessed and managed by Executive Committee Directors.
This segregation ensures that risks related to our strategy and major decisions are considered at Main Board level and that our level of risk appetite remains appropriate. Day to day operational risks are more closely reviewed and managed by the Executive team and senior management, with linkage between the two managed as appropriate.
Risk registers are maintained by the Main Board for strategic risks and by the Executive Committee for operational risks. The absolute levels of risk, the net levels of risk taking into account mitigating controls and the appropriate level of risk appetite are reviewed regularly. High rated risks identified in the registers are regularly reviewed by the Board, Audit and Executive Committees.
Details of our principal strategic risks and the mitigating activities in place to reduce these risks are set out below.
| Strategic risk | Mitigating activities | Change | |
|
Financing |
Funding requirements for business plans reviewed regularly and options for alternative sources of funding monitored. Range of banking relationships maintained, refinancing strategy reviewed regularly. Interest rate hedging policy in place to minimise exposure to short-term rate fluctuations.
|
Reduced |
| Strategic risk | Mitigating activities | Change | |
|
Property Valuation |
Investment market mood monitoring. Market yields and pricing of property transactions monitored closely across the London market. Alternative use opportunities pursued across the portfolio and planning consent progressed. Sufficient headroom on Loan to Value banking covenants is maintained and reviewed. |
No Change |
| Strategic risk | Mitigating activities | Change | |
|
Occupancy |
Weekly monitoring of occupancy levels, demand, pricing and reasons for customers vacating at each property and exit interviews conducted. On-site staff maintain regular contact with customers and local monitoring of competitors offering space. Extensive marketing using the Workspace brand. Flexibility offered on deals by dedicated in-house marketing and letting teams. |
No Change |
| Strategic risk | Mitigating activities | Change | |
|
London |
Regular monitoring of the London economy, research reports and the commissioning of relevant research. Regular meetings with the GLA and London Boroughs. |
No Change |
| Strategic risk | Mitigating activities | Change | |
Impact to underlying income and capital performance due to: |
Understanding of planning environment and use of appropriate advisers. Detailed development analysis and appraisal undertaken, sensitivity and risk scenarios considered. Board level discussion and approval prior to project commitment. Contract structuring to reduce/eliminate build risk.
|
No Change |
| Strategic risk | Mitigating activities | Change | |
Underperformance due to inappropriate strategy of: |
Regular monitoring of asset performance and positioning of portfolio. Acquisition due diligence appraisal and business plans analysis. Regular monitoring of acquisition performance against target returns. |
No Change |
| Strategic risk | Mitigating activities | Change | |
|
Transactional |
Review and monitoring of potential joint ventures before agreed. Requirements for business plans are reviewed regularly. Regular review of performance of joint ventures throughout term.
|
No Change |
| Strategic risk | Mitigating activities | Change | |
|
Regulatory |
REIT conditions monitored and tested on a regular basis and reported to the Board. Close working relationship maintained with appropriate authorities and all relevant issues openly disclosed. Advisers engaged to support best practice operation. |
No Change |
| Strategic risk | Mitigating activities | Change | |
|
Business Interruption |
Continual monitoring of security threat. Business Continuity plans and procedures in place and regularly tested.
|
Reduced |
| Strategic risk | Mitigating activities | Change | |
|
Reputational |
Customer survey undertaken and results acted upon. Training and mystery shopper initiatives undertaken. Regular communication with stakeholders. |
No Change |
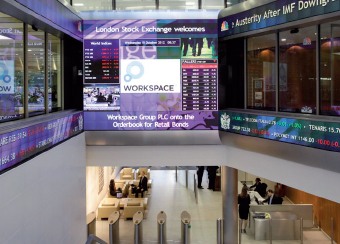
RETAIL BOND ISSUE
Workspace launched a Retail Bond in October 2012, successfully raising £57.5m.

ENHANCED REPORTING PROCEDURES
Our development team report directly to the Board on costs and programme of all larger developments.

BUSINESS CONTINUITY
This year we have established a new Business Continuity office at Southbank House, SE1 7SJ.

LLOYDS AVENUE, EC3N 3AX
One of the five new buildings acquired this year through the BWPT joint venture.